Business QuestionDemand drops by 15%

Scenario Modeling
Software to See Business
Impact Before You Act
Predien's scenario modeling software helps you test business decisions before you act.
Change an input, see how it affects your numbers, and understand the likely outcome.
Create ScenariosExplore possible responses
AI Evaluates OptionsAnalyzing impact, risks & constraints
Recommended DecisionsIncrease safety stock & optimize schedule

Key Considerations
- Inventory Impact
- Service level
- Operating Cost
- Capacity Constraints
What Best Decisions are you trying to make?
Business scenario planning starts with the what-if questions. So, pick the one
closest to what you're facing.

Decision Intelligence Capabilities That
Fit Your Business Needs.
Test a decision using our scenario planning software capability, work backward from
a target, compare your options, and build on the read that's actually accurate for your
numbers, not a guess, using your connected business data.
Test changes before you commit. See how every lever moves your outcomes.
Set a target. We'll show the variables that get you there. Faster.
Uncover relationships that matter. Spot drivers, reduce risk, act with confidence.
Project forward with AI-powered forecasts. Plan smarter, stay ahead.
Compare scenarios side by side. Choose the best path with clarity.
Predien's Scenario Modeling Software, Applied to
a Real Decision
As scenario planning software, Predien tests several forecasting methods against your numbers and applies
whichever one actually fits, so you're deciding on the most accurate read, not just the easiest one to produce.

Predien automatically identifies every metric connected to your driver through statistical correlation rather than manual mapping, then calculates the elasticity between them.
The result: leadership sees the full ripple effect of any decision: which inputs matter most, and how strongly each one moves the outcome.
View Scenario Capabilities →Five forecasting methods for steady growth, accelerating growth, recurring seasonal swings, short-term cycles, and combined patterns run automatically, and your forward-deployed analyst can step in to adjust where the data alone can add value.
- Steady Growth
- Accelerating Growth
- Seasonal Swings
- Short Term Cycles
- Combined Patterns
Full Visibility of Every Metric for Operational
Scenario Planning
Use one system to test decisions, work backward from targets, compare strategic options, and build a
stronger planning baseline
IntakeDiagnosisPathwaysSimulationEvaluate
Three ways forward
Each pathway uses different combinations of drivers. Select one to simulate.
Selection rationale: Generated 5 candidate pathways. Dropped: (1) 'Margin-Only Play': insufficient gap coverage at 34%, revenue problem needs revenue levers; (2) 'New Market Blitz': required 50% increase in new account acquisition, far exceeding 18-month historical variance of +/-25%. Selected 3 span conservative recovery, balanced value growth, and aggressive full offensive.
Account Recovery Sprint
RECOVERYStop the bleeding first: recover lapsed accounts, rescue declining ones, and clear the contact backlog to stabilize the customer base before pursuing growth.
- Active Account Count
- +4%
- Dormant Account Count
- -8%
- Cadence Overdue
- -20%
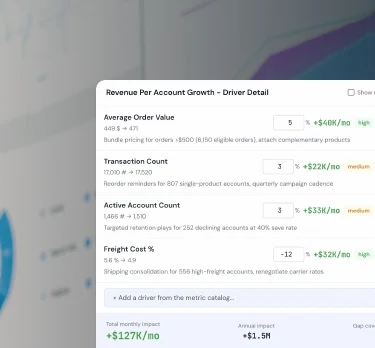
Revenue Per Account Growth
BALANCEDInstead of chasing new accounts, extract more value from the existing base through higher order values, more frequent orders, improved freight economics, and modest account recovery.
- Average Order Value
- +5%
- Transaction Count
- +3%
Full Recovery Offensive
GROWTHAttack the gap from all angles simultaneously: recover lost accounts, grow existing ones, acquire new ones, and increase sales team productivity. Higher risk but closes the full gap.
- Active Account Count
- +6%
- Average Order Value
- +4%
- Dormant Account Count
- -12%
What makes Predien's scenario
planning software different
Small inefficiencies compound. By the time they surface in a report, they've already
cost margin, cash, or momentum. Predien closes that gap.

Models built for your business.
Connected to your own numbers and shown the way leadership actually reads results: summary cards, trend breakdowns, and clear direction you can act on right away.

Comparison that holds up in the boardroom.
Run several scenarios at once and see the full difference across every number they affect, laid out the way you'd present it in a leadership meeting.

Outcome-First Modeling
Tell Predien the result you want on margin, revenue, or cost, and it works backward to show you the changes required to get there. No trial and error.
Bring the decision you are
weighing right now
See it tested on your own business numbers before you commit.
Who this is for
Predien is built for mid-market leaders whose business has outgrown their current analytical capabilities.
What happens next
Email one line with the decision you are weighing. It goes to the person who would run your Sprint, and they come back within one business day.
