
DECISION INTELLIGENCE · DASHBOARDS & REPORTING

The numbers are live. Somebody is watching.

A forward deployed analyst watches the numbers continuously. What reaches you has already been checked.

Built for operators and executives carrying $10M to $500M in revenue.

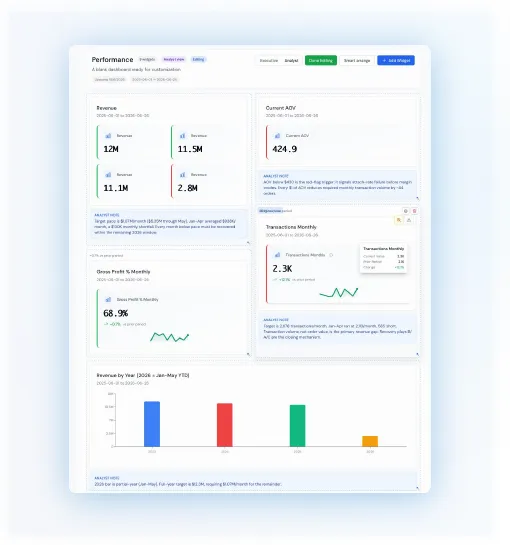
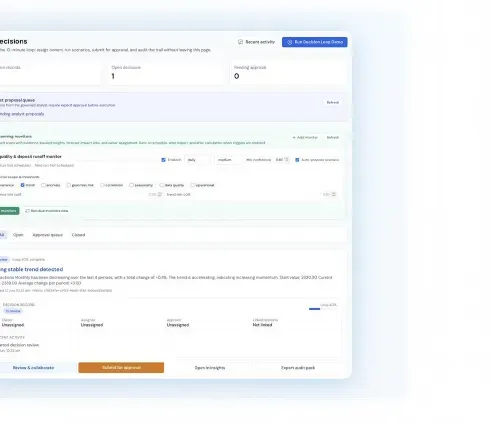
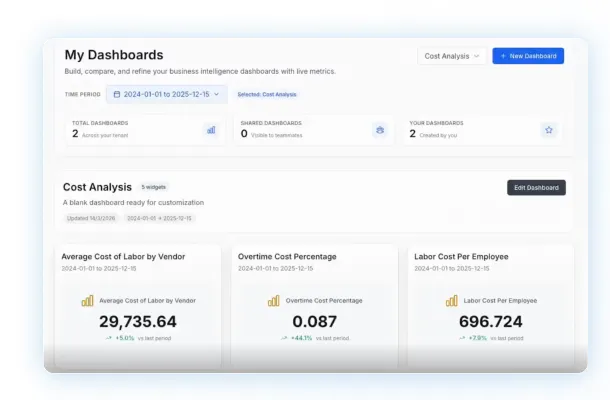
Predien dashboard with live operating metrics

One dashboard. Your categories. Already configured.

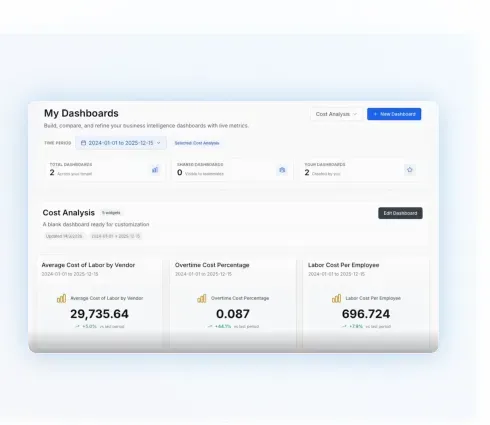
The operator opens one view. Every metric the operation runs on, in one place, current as of this morning. The forward deployed analyst configured it during onboarding in the categories the business already uses: sites, customers, shifts, service tiers. The leader reads a finished view. Nothing to assemble. Nothing to export and rebuild for a board deck.

Once the model is live, the watch runs. Every configured metric is monitored for anomalies, variance from expectation, and trend breaks.

AI is what makes monitoring at this speed possible. The watch runs continuously so the flags arrive this week, while the period is still open.

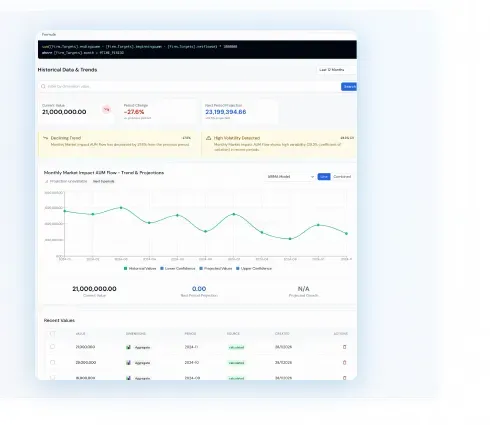
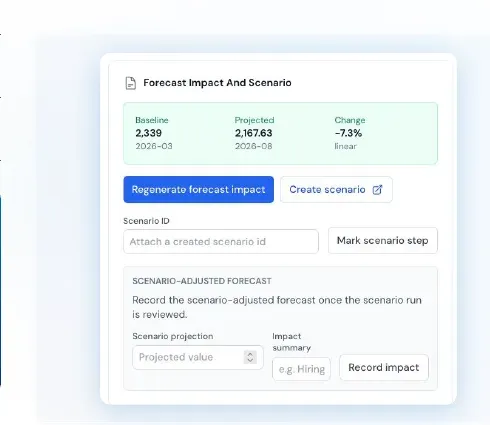
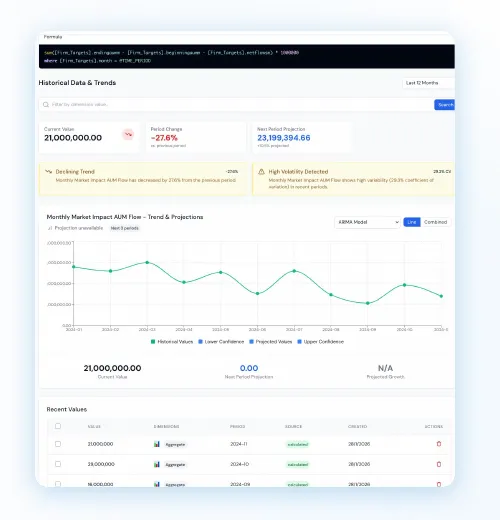
Driver model connecting operating metrics to the categories the business uses

Before anyone knew to look.

When one number consistently leads another, that relationship surfaces on its own. A cost-per-unit trend at one site that reliably predicts a margin shift across the region. The watch surfaces the connection. The analyst confirms it, adds context, and from that point forward the operator sees the second number coming before it moves.

The operator did not configure this. The model found the connection on its own, and the analyst publishes it before it reaches the executive.

Twenty-six detected this week. Six published. The rest was noise.

20–30Detected weekly
5–7Published to act on
01Detection to publicationWeekly

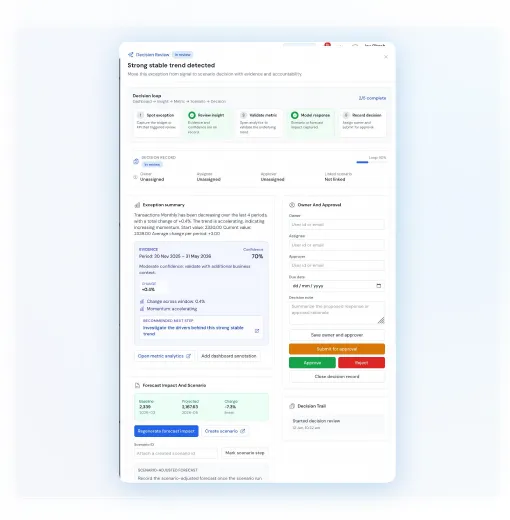
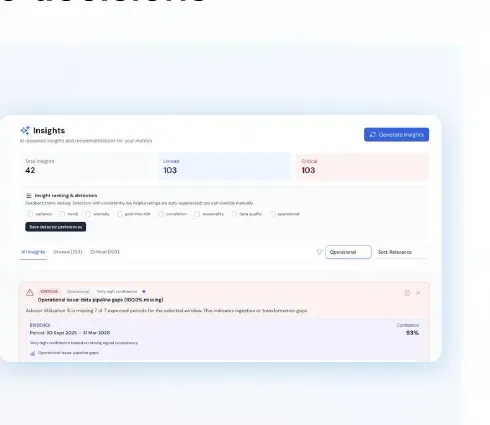
In a normal week the model detects twenty to thirty anomalies. Most are noise: data artifacts, seasonal patterns, corrections that resolve themselves. The forward deployed analyst reviews each one, confirms which are real, adds the operating context, and publishes the five to seven worth acting on.

02Context and qualificationPer flag

Each published flag carries a description of what moved, the context of why it matters to the operation, and a qualified dollar-impact estimate produced through scenario modeling. The executive reads six flags that have already been checked, each with enough context to act on or set aside. No meeting to decode it.

03Operator-defined thresholdsAt onboarding

The thresholds that drive the watch come from the operator. Labor cost per unit at a location. Billing accuracy by customer. Overtime as a share of total hours. Whatever the business watches gets set during onboarding, in the operator's vocabulary, by the forward deployed analyst.

Insights feed showing detection queue alongside published flags

Bring the number you check every Monday morning.

See it live, watched, and curated by an analyst who knows the operation.

Tell us the number you assemble by hand every week. An analyst reviews it and comes back within one business day with how Predien would monitor it and what the Sprint would cover.